Welcome
This is the personal homepage of Timm Schoening. I am a data scientist working in marine science and use this website to present some of the results from that work. This page lists some topics i am - and have been - working on. More details such as journal articles from those projects are given in my CV.
Research
I am the head of the Data Science Unit at the GEOMAR Helmholtz-Centre for Ocean Research Kiel. My work aims to understand the oceans with methods of data science such as machine-learning and visualization.
My current research focus is on turning heterogeneous and big data sets into quantitative information. A past focus was on marine imaging and most recently on making marine image data FAIR.
I am experienced with many marine science processes from data acquisition with traditional and robotic platforms, through data processing and publication towards interpretation and publication.
Person
I am currently 42 years old and live in Kiel, Germany with my wife and son.
I studied at Bielefeld University and hold a Bachelor, Master and PhD in "Computer Science in the Natural Sciences".
In my spare time, I like to do gardening - for crops as well as flowers, crafting around the house, board games and spending time outside with our dog.
I also love to be at sea - to acquire data and look at the open ocean wondering whats underneath.

Selected projects

Research: FAIR marine images
Achieving FAIRness of any kind of data type is an open challenge on the road to digital science. Achieving FAIRness of image data is particularly complex as images are massive in size compared to most other data types and inherently unstructured: there are no numeric values to utilise on the way. Making marine images FAIR is an international effort with contributions from national stakeholders (like the HGF DataHub), international research programs (like the UN Decade of Ocean Science) and focus groups (like the Marine Imaging Community) to name few. We propose a metadata format for marine image data that acts as a hub to map between existing standards (like Darwin Core, Audubon, PDS4) that are restricted to particular use-cases or generic in nature.
Research: Monitoring deep sea mining activities
Deep sea mining is imminent and monitoring the mining activities and impacts is an open research question. In the context of man international mining projects (MIDAS, Mining Impact 1&2) I have been working on developing tools (automated image analysis, image annotation software, data management frameworks) to facilitate objective data analysis and comprehensive data reporting. These could be tools to be implemented into mining codes and be used by mining companies or independent bodies to monitor activities in the deep sea. A particular focus has been on the in-situ monitoring of seafloor sediment plume distributions created by (simulated) mining activities. Not only image data was analysed (to map the extend of plume redepositioning) but also the direct suspended plume measurement with square-kilometer arrays of optical and acoustical senors.


Research: Estimating polymetallic-nodule abundance
In this project, operated in cooperation with the BGR and within the JPI Oceans project Mining Impact, the amount, size and finally mass of polymetallic nodules lying on
the seafloor shall be estimated. For decades, research on these mineral resources has been conducted, depending on the world market. Currently a UN organization
(the ISA) governs the exploration and intended exploitation. To monitor the minerals as well as the diverse biology in this sensitive habitat, precise measurements
are required. This includes detections of the nodules as well as the biology.
The first part of this project was targeted to derive the percentage of the seafloor covered in nodules. Subsequently more detailed segmentations yielded single nodule
sizes, and, combined with automatically detected lasermarkers, the relative size of the nodules in cm. In upcoming studies, the developed algorithms will be extended
to estimate the nodules amounts, covered with sediments to increase the estimation accuracy.
The learning is done with the C++ library mllib, image processing with the opencv library.
Visualizations and explorations are realised with Zeus and Pan.
See the publications page for results of this work.
Research: Automated detection of megafauna
One of the major projects, is the automated detection of megafauna (as well as flora and structures created by those animals).
I started about three years ago and have been working on it with some longer breaks for the manganese nodule project.
It is a cooperation with the Alfred Wegener Institut, the National Oceanography Centre and the JPI Oceans partners that provide the image data. The aim of the project is to create an automated detection system that incorporates the expertise of the biologists while keeping their input as small as possible. Parameters for different steps of the system are derived
from a fully-annotated workshop transect. As the central part, supervised machine-learning is applied.
The learning is done with C++ libraries, the image processing is done with the superb opencv library.
Results of this project were so far published as a PloS One journal article, as a conference talk at the
OCEANS '12 and the DSBS 2012 and as a poster at the GEOHAB 2013.


Software: OceanCV
Image analysis is a resource-intense task and the excellent OpenCV library is extensively used for this task. To expand it with functionality optimised for marine image analysis the OceanCV library was created that collects a variety of machine learning and image processing tools and algorithms. Most of these were developed in the research projects and are available as open source code.
Software: Manual Image Annotation with DIAS
BIIGLE is an online image-browsing software for the manual analysis of image transects,
especially underwater camera cruises (see below).
In an effort to evolve the BIIGLE tool to current state-of-the-art infrastructure and additionally extend its functionality to improve the scientific validity and robustness of annotation data, the DIAS (DIAS Image Annotation Software) was implemented. The version hosted by GEOMAR is the Alpha version that was created for on-ship use during the research cruises SO239 and SO242-1 for a manganese nodule project.
Software: Copria
Copria (or "collaborative pattern recognition & image analysis") is a web-based data flow processing software. The graphical user interface is developed in common web technology (HTML5, JS, jQuery) and adds upon a MySQL database. The purpose of copria is to allow for an efficient usage of complex data processing pipelines, to share such pipelines among scientists for collaborative exploration of complex and big data stacks. A pipeline thereby consists of several atomic processing "nodes" that are currently developed for the whole range of pattern recognition, data mining, image processing and visualization tasks. Pipelines are executed on the CeBiTec compute cluster to provide high efficiency.

Software: Ares, Hades & Athene
Most of the machine-learning and image-processing done in the various projects is time-consuming and not feasible to be done on a single computer. The CeBiTec thus has a compute cluster with around 2,000 cores. To start jobs, run them and monitor their progress, i developed Ares (PHP, job start), Hades (C++/PHP, file server interface and job_control) and Athene (PHP, job progress and results).
Software: Demeter, Apollon, Zeus
While the learning and other computations are time-consuming, the evaluation of results has to be web-based to ease the exchange between researchers
while still allow to be dynamic and explorative, in essence: rapid-prototypal. Therefor i implemented a suite of frequently used PHP scripts
that ease the interplay between results and original data. Some are very fundamental extensions, suitable for any PHP project (Athene), some more focused
on machine-learning and image-processing (Apollon).
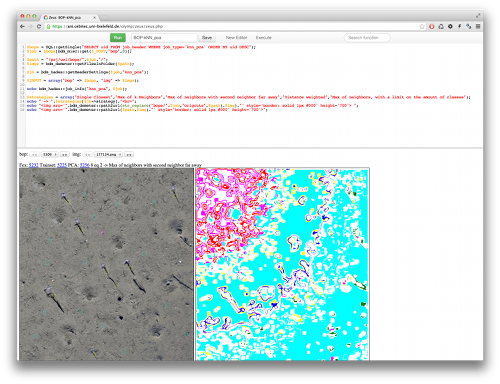
To ease the processing and allow rapid access to the data as well as the algorithms, Zeus was developed. It is a webpage with an editor section
at the top, where scripts can be created and manipulated. The lower part is the section where the results of the execution of these scripts will be displayed.
Zeus has access to the scripts of Demeter and Apollon. If a script is relevant to other users, it can be made accessible without the editing option,
making the sharing of results simple and efficient.
Software: Hermes & Pan
Most evaluations can be done with Zeus. Others though require a more sophisticated GUI and depend on a wider code base. Those evaluations
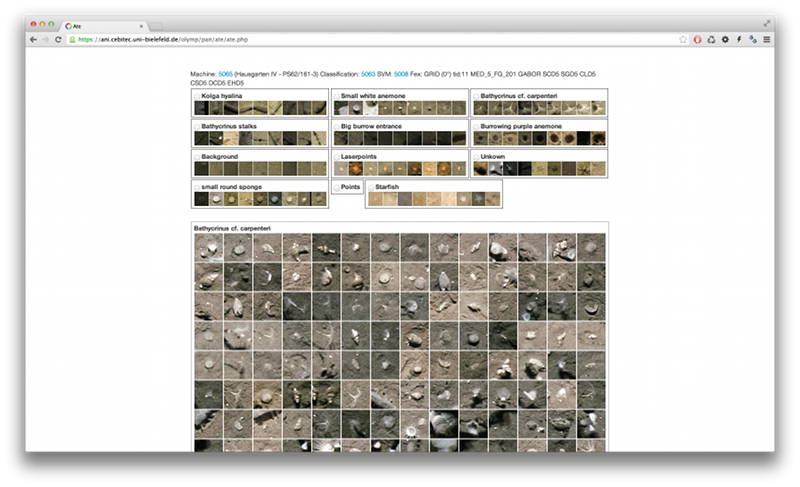
(mostly dynamic visualizations) are bundled in Pan. Currently, there is a simple JavaScript version of HydeON (Atlas), a transect-wise visualization
of the polymetallic nodule detection and a re-evaluation tool to browse the detections made by iSIS (Ate).
These tools are written in PHP and JavaScript, relying on jQuery. Ajax calls are handled via a JSON-RPC server developed specifically for the Olymp context.
It is called Hermes and implements a REST server with user login data managed by sessions (thus not really stateless).
Software: mali
Mali is a collection of machine-learning and image-processing algorithms written in C++11. It contains a vector-based data-structure and incorporates vector-expressions to increase the performance. Some basic algorithms originate in other projects and were wrapped to confer to the fundamental data-structure. Mali was a combined effort of several Ph.D. students and is a major advancement of the previously used mllib.

Research: Ripley's-K function applied to brain tissue images, M.Sc.
My master's thesis dealt with the application of an algorithm originating in the field of ecology (Ripley's-K function) to brain tissue images. Ripley's-K and its subsidiaries,
Ripley's-L and the O-ring statistic give information about the evenness of a two-dimensional point distribution. It was first used to
describe the relative occurence of a single plant species and then extended to incorporate multi-class relationships (like: "do lions aggregate around ponds?").
In my case, i used brain tissue images, created by the Neuropathological institute of the Bethel hospital. The tissue samples were taken from patients
with epilepsia. The task was to automatically detect irregularities in the cell-distribution within the tissue. Usually, the neural cells form a layered pattern,
but for sick patients, this pattern is severely damaged and thus irregular. These irregularities were detected by the abnormal Ripley's-L statistic.